|
| INTRODUCTION |
| Floating
marinas, floating breakwaters and floating bridges are long structures made up of pontoons
which are connected between them rigidly or with flexible connectors, and they are
anchored at the bottom of the sea with mooring lines. They are usually placed in protected
water regions. The waves in these regions are short crested waves. The dynamic analysis of
long floating structures in short crested waves must take into account the special
characteristics of the short crested wave loading, and the frequency depended load
correlation along the structure. The
structural modelling using finite element methods does not present any difficulties.
However the part of the analysis which presents special problems is the modelling of the
loading in a short-crested sea. General purpose finite element programs do not provide
methods for calculating the loading in a stochastic, short crested sea, and additional
routines should be included in order to do the job. In conclusion the use of general
purpose finite element programs is - time consuming, uneconomic, and susceptible to
errors.
The program cgFLOAT has been developed especially for long floating
structures in short crested sea loading. The dynamic response can be calculated via a
frequency or time domain analysis. Theories and methods for hydrodynamic loading,
short-crested waves, directional wave spectra, sea state simulation, and stochastic
dynamics are included in the calculation routines. The computer code has been optimized
taking into account the special characteristics of the structure and the loading. For the
response calculation a Monte-Carlo simulation is used. This method is considered to be
more advantageous over the usual frequency domain analysis, which is the only alternative,
because it reduces the computational cost considerably and can be used for frequency and
time domain analysis. It is based in simulating sets of nodal load series and calculates
the structural response by deterministic dynamic analysis in frequency or time domain. The
expected response values are obtained in the end by calculating the ensemble statistics
between the simulated cases. The basis for computing the sets of nodal load series is the
wave coherence along the structure, which is obtained from the directional wave spectrum.
|
|
PROGRAM CAPABILITIES The program
combines fluid, structural, and stochastic process theories in one program. Thus the
response computation of long floating structure is reduced to a routine analysis.
The following aspects have been implemented in the program:
- Modelling of continuous structures and structures with flexible
connectors between the pontoons.
- Eigenvalue solution
- Frequency domain analysis
- Time domain analysis
- Boat wake analysis
- Short-crested waves defined by a wave spectrum and wave coherence.
- Monte-Carlo simulation of the wave loading.
- Statistical evaluation of the results for the simulated response.
- Frequency dependent hydrodynamic coefficients.
- Metric or Anglo-American units can be specified.
- Graphical output, for mode shapes and response values along the
structure.
|
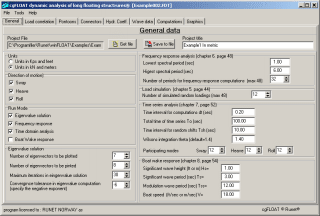
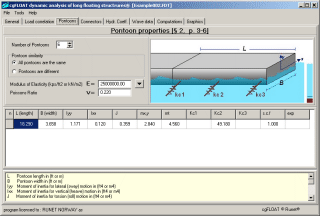
| INPUT Structural input data are the characteristics of the pontoons, length, width,
height, moments of inertia, shear areas, elasticity modulus, and elastic characteristics
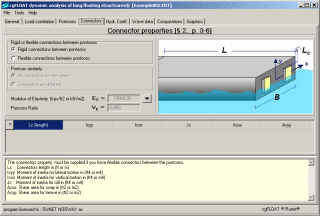
of moorings. In case of flexible connectors the characteristics of the connectors as
bending and shear stiffnesses must be described. The geometry of the structure and the
nodal points are automatically generated by the program after the basic pontoon and
connector properties are supplied. In case (as in most cases) of similar pontoons the
characteristics of one pontoon is necessary and the number of pontoons.
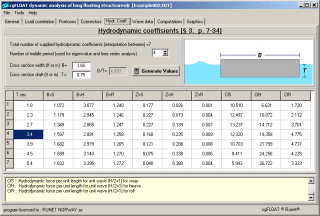
For pontoons of rectangular cross section the hydrodynamic coefficients (added mass, added
dumping and hydrodynamic forces) for various frequencies are automatically evaluated by
the program. For other cross sections you may input the hydrodynamic coefficients for
certain wave frequencies and the program interpolates between them for the necessary
values in the response calculations.
|
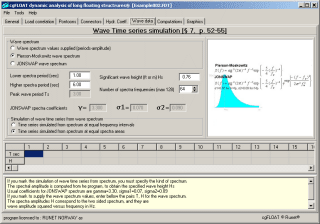 |
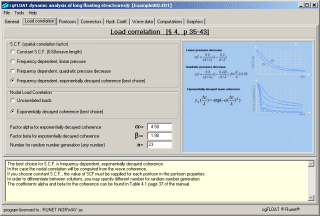
The short-crested sea state is
specified by the wave spectrum and the wave coherence. Typical wave spectra like
Pierson-Moskowitz, JONSW AP, are computed from their parameters by the program. Other
kinds of spectra can be used by inputting their f and S(f) values. Wave time series are
simulated from the spectra, via various methods, by the program. The wave correlation is
handled by specifying the coefficients of an exponentially decayed wave coherence, or by
specifying the nodal load correlation directly.
In the case of boat wake analysis the speed and characteristics of the boat wake are
specified.
For the frequency domain analysis, the frequencies for the computation of the frequency
response function can be specified or they are computed by the program after their number
is specified. For the time domain analysis, participating modes, integration method and
parameters, accuracy, time interval and time length are specified. The user specifies the
various analysis paths, units, simulation methods and number, and required printed or
plotted output quantities. For all the cases if general parameters are not specified by
the user, default values assigned by the program. |
 Mode shapes
Frequency response
Time domain response
Revised:
Φεβρουαρίου 11, 2026. |
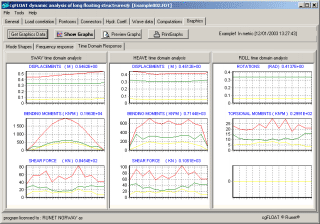
OUTPUT The results from the frequency or time domain analysis is a
large number of values. To be useful they are printed in graphs.
A typical output of the program contains:
- A printout with all the information of the structure, the wave field,
assumptions and parameters used.
Printout of the eigenvalues
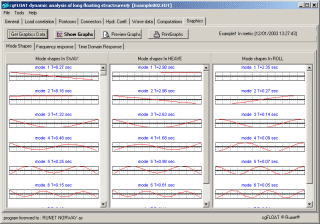
Graphs of mode shapes
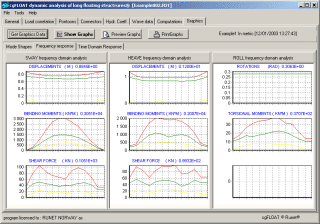
Graphs of the structure response to unit amplitude
short crested waves of various frequencies.
Graphs of ensemble maximum, mean, and standard
deviation values, between the simulated responses, for displacements, bending moments, and
shearing force, along the structure for the three directions of motion (sway, heave and
roll).
The computations are for frequency domain analysis and for
time domain analysis.
From the displacements in sway motion the mooring forces can be computed.
|
| Please note that these files require you have the Adobe Acrobat
Reader installed. If you don't have the reader, click here
to download it. (its free) |
 |
|
 |
|
| GENERAL
REMARKS The program is well documented. In addition
to the user manual, references 1-6 explain in detail the theoretical aspects behind the
computational and simulation methods as well as the concept of hydrodynamic forces and
short-crested waves. Detailed examples are included to show the correct use of the
program.
The accuracy of the program has been checked with in situ
measured response values at the Hood-Canal floating bridge and other floating breakwaters
in the Puget Sound area.(1) |
|
Download FREE trial version
of cgFLOAT |
|
|

